Armand Emamdjomeh Visual Journalist
Portfolio
Editing
Coronavirus data trackers
Throughout the pandemic, I've managed our coronavirus data tracking pages for our U.S. and international trackers, and have assisted with our regional tracker. In the first few months, as we tried to get a handle on an ever-changing data situation, I helped to bring in engineering resources to turn what was originally a manual update process to a live automated one.
For the pages themselves, we focused on creating clean, simple data visualizations, trying to present the reader with as simple of a view onto a complicated topic.
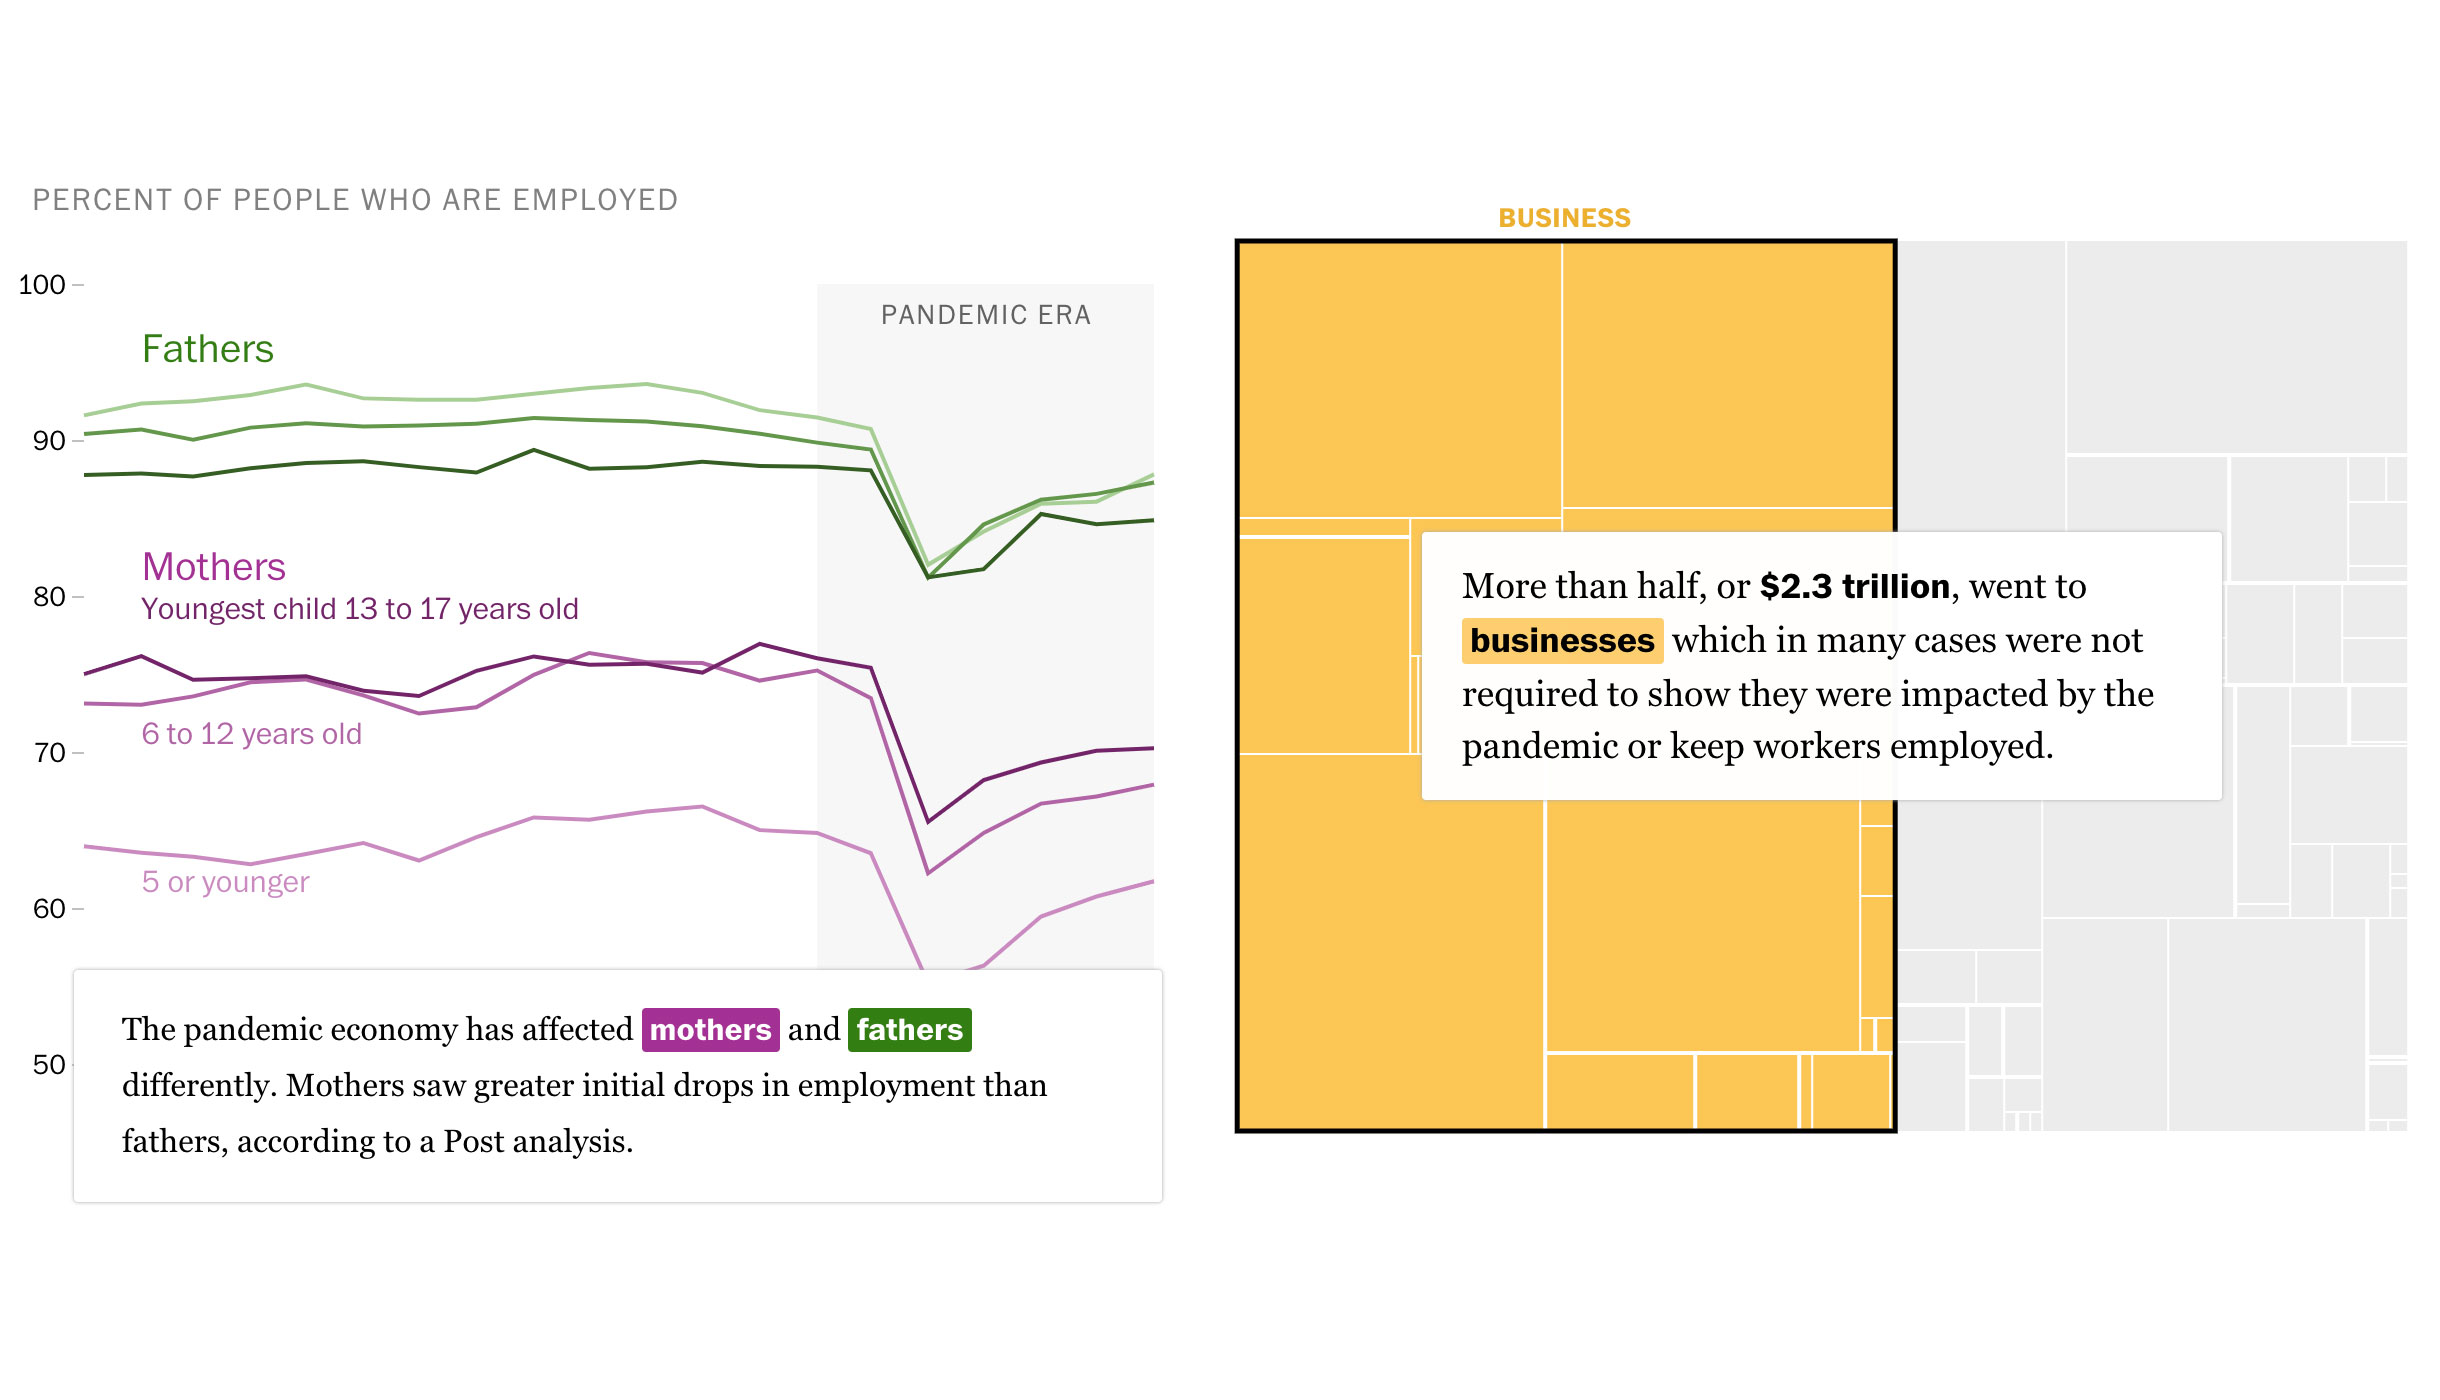
‘Doomed to fail’: Why a $4 trillion bailout couldn’t revive the American economy
The covid-19 recession is the most unequal in modern U.S. history
These two pieces ran as one package looking at the economic impacts of the pandemic in the U.S. I worked with three graphics reporters and coordinated with two different teams on the Business desk to create interactive graphic experiences that explained the complicated data behind these stories to readers.
Reporting
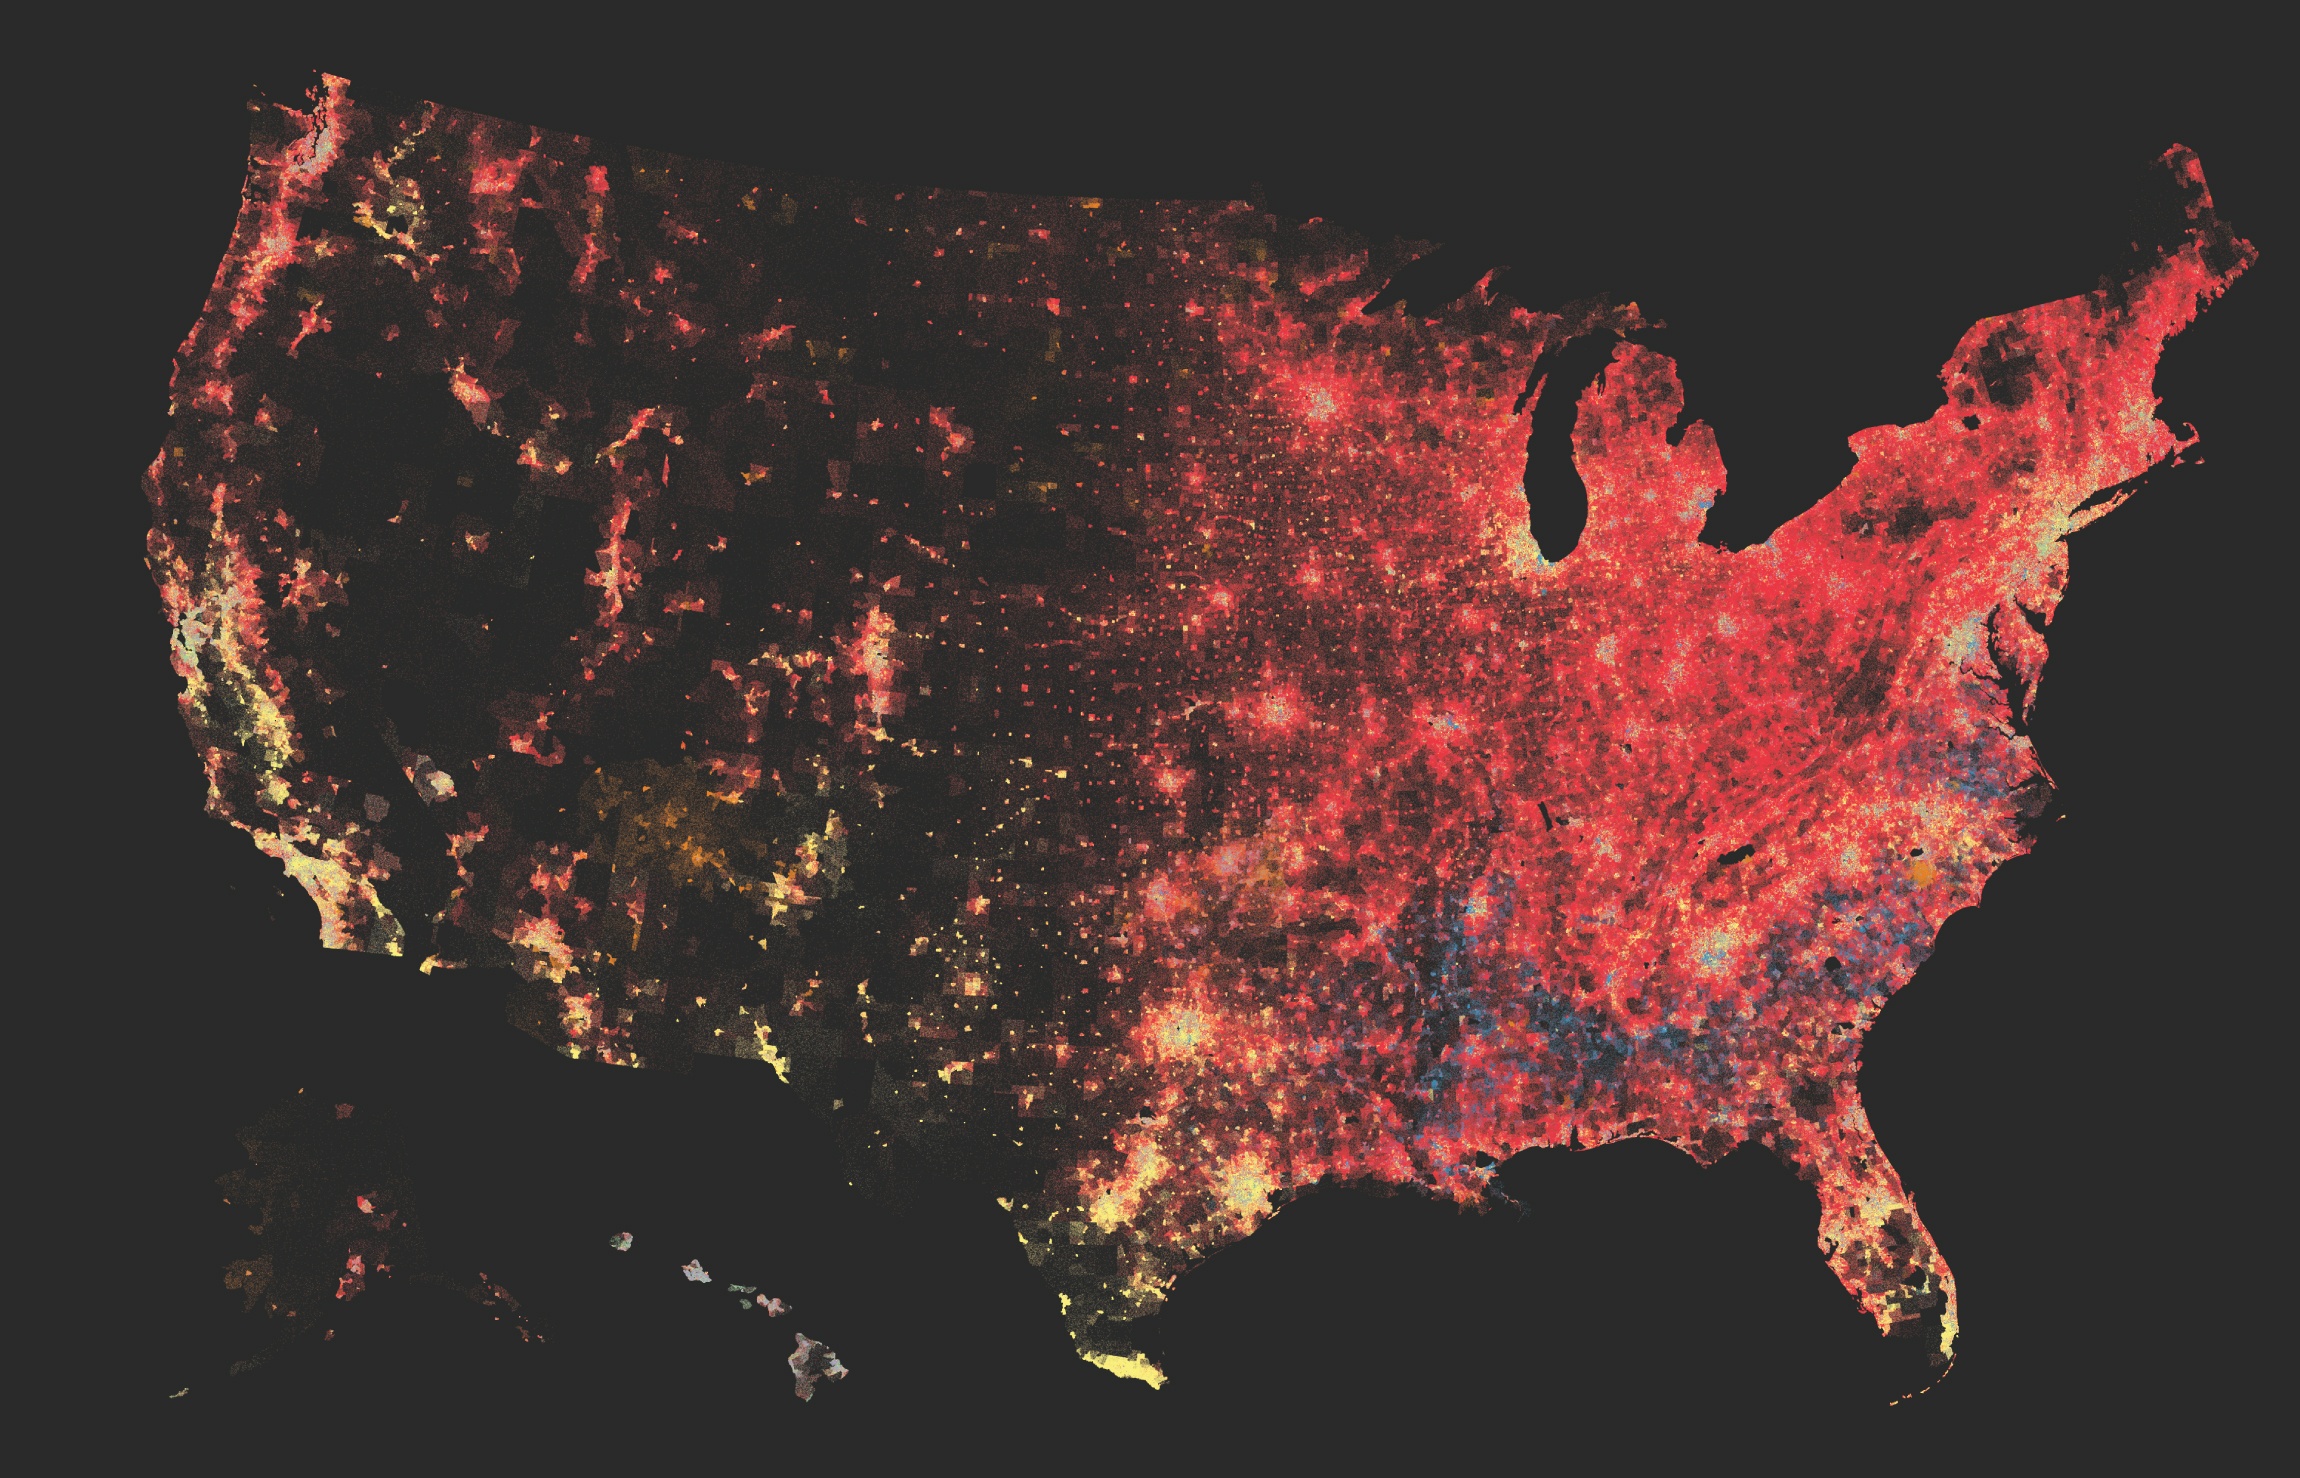
America is more diverse than ever, but still segregated
Working with my colleague Aaron Williams, I helped create the interactive Mapbox-based maps on this story that looked at demographic changes throughout the U.S. While Aaron was the lead reporter on this project, I developed the color schemes and optimized the maps and data to achieve the highest dot density levels possible.
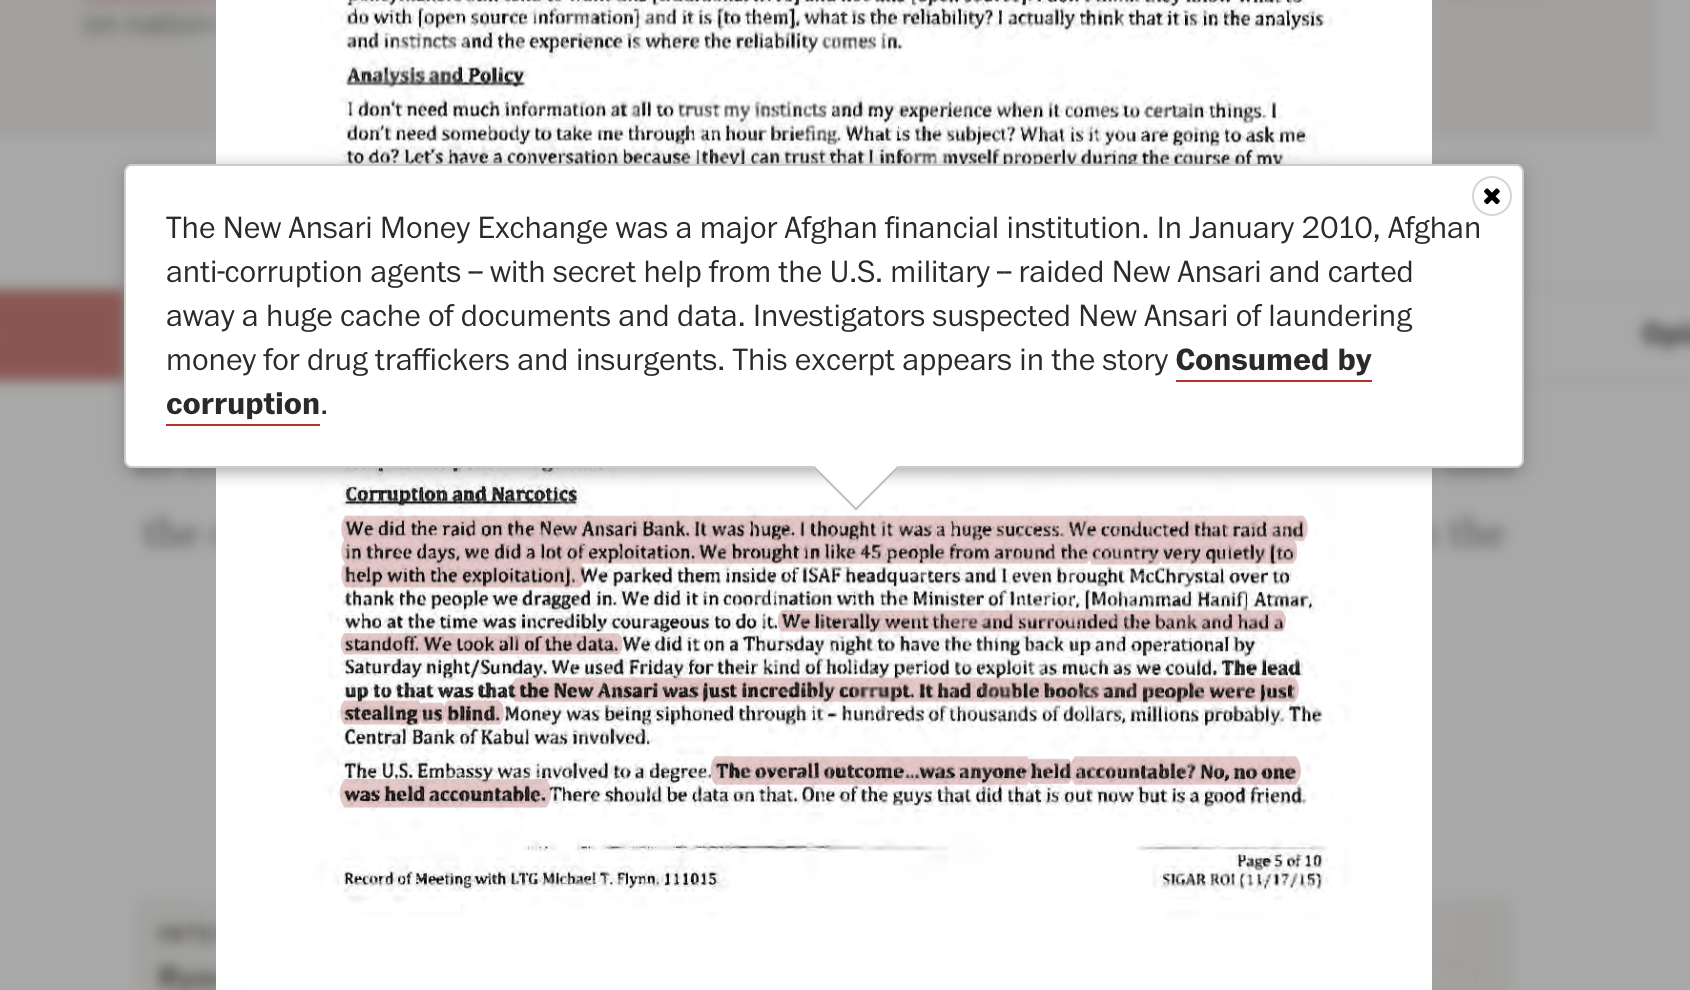
The Afghanistan Papers: A secret history of the war
Our idea for this story, based on a trove of documents detailing what officials knew about the Afghanistan War, was for the reader to be able to reference the quotes in the documents directly from the six stories in the series, and also for the repoter to be able to annotate the documents to explain parts of them to the reader.
To this end, I developed a workflow that allowed the reporter to annotate PDFs, then extract those into a separate document for copy and line editors to make edits, then re-insert them into the documents. This saved us the confusion of having lots of potential copies of the documents drifting about. I also developed ways to automatically link quotes highlighted in the PDFs to where they were referenced in the stories.
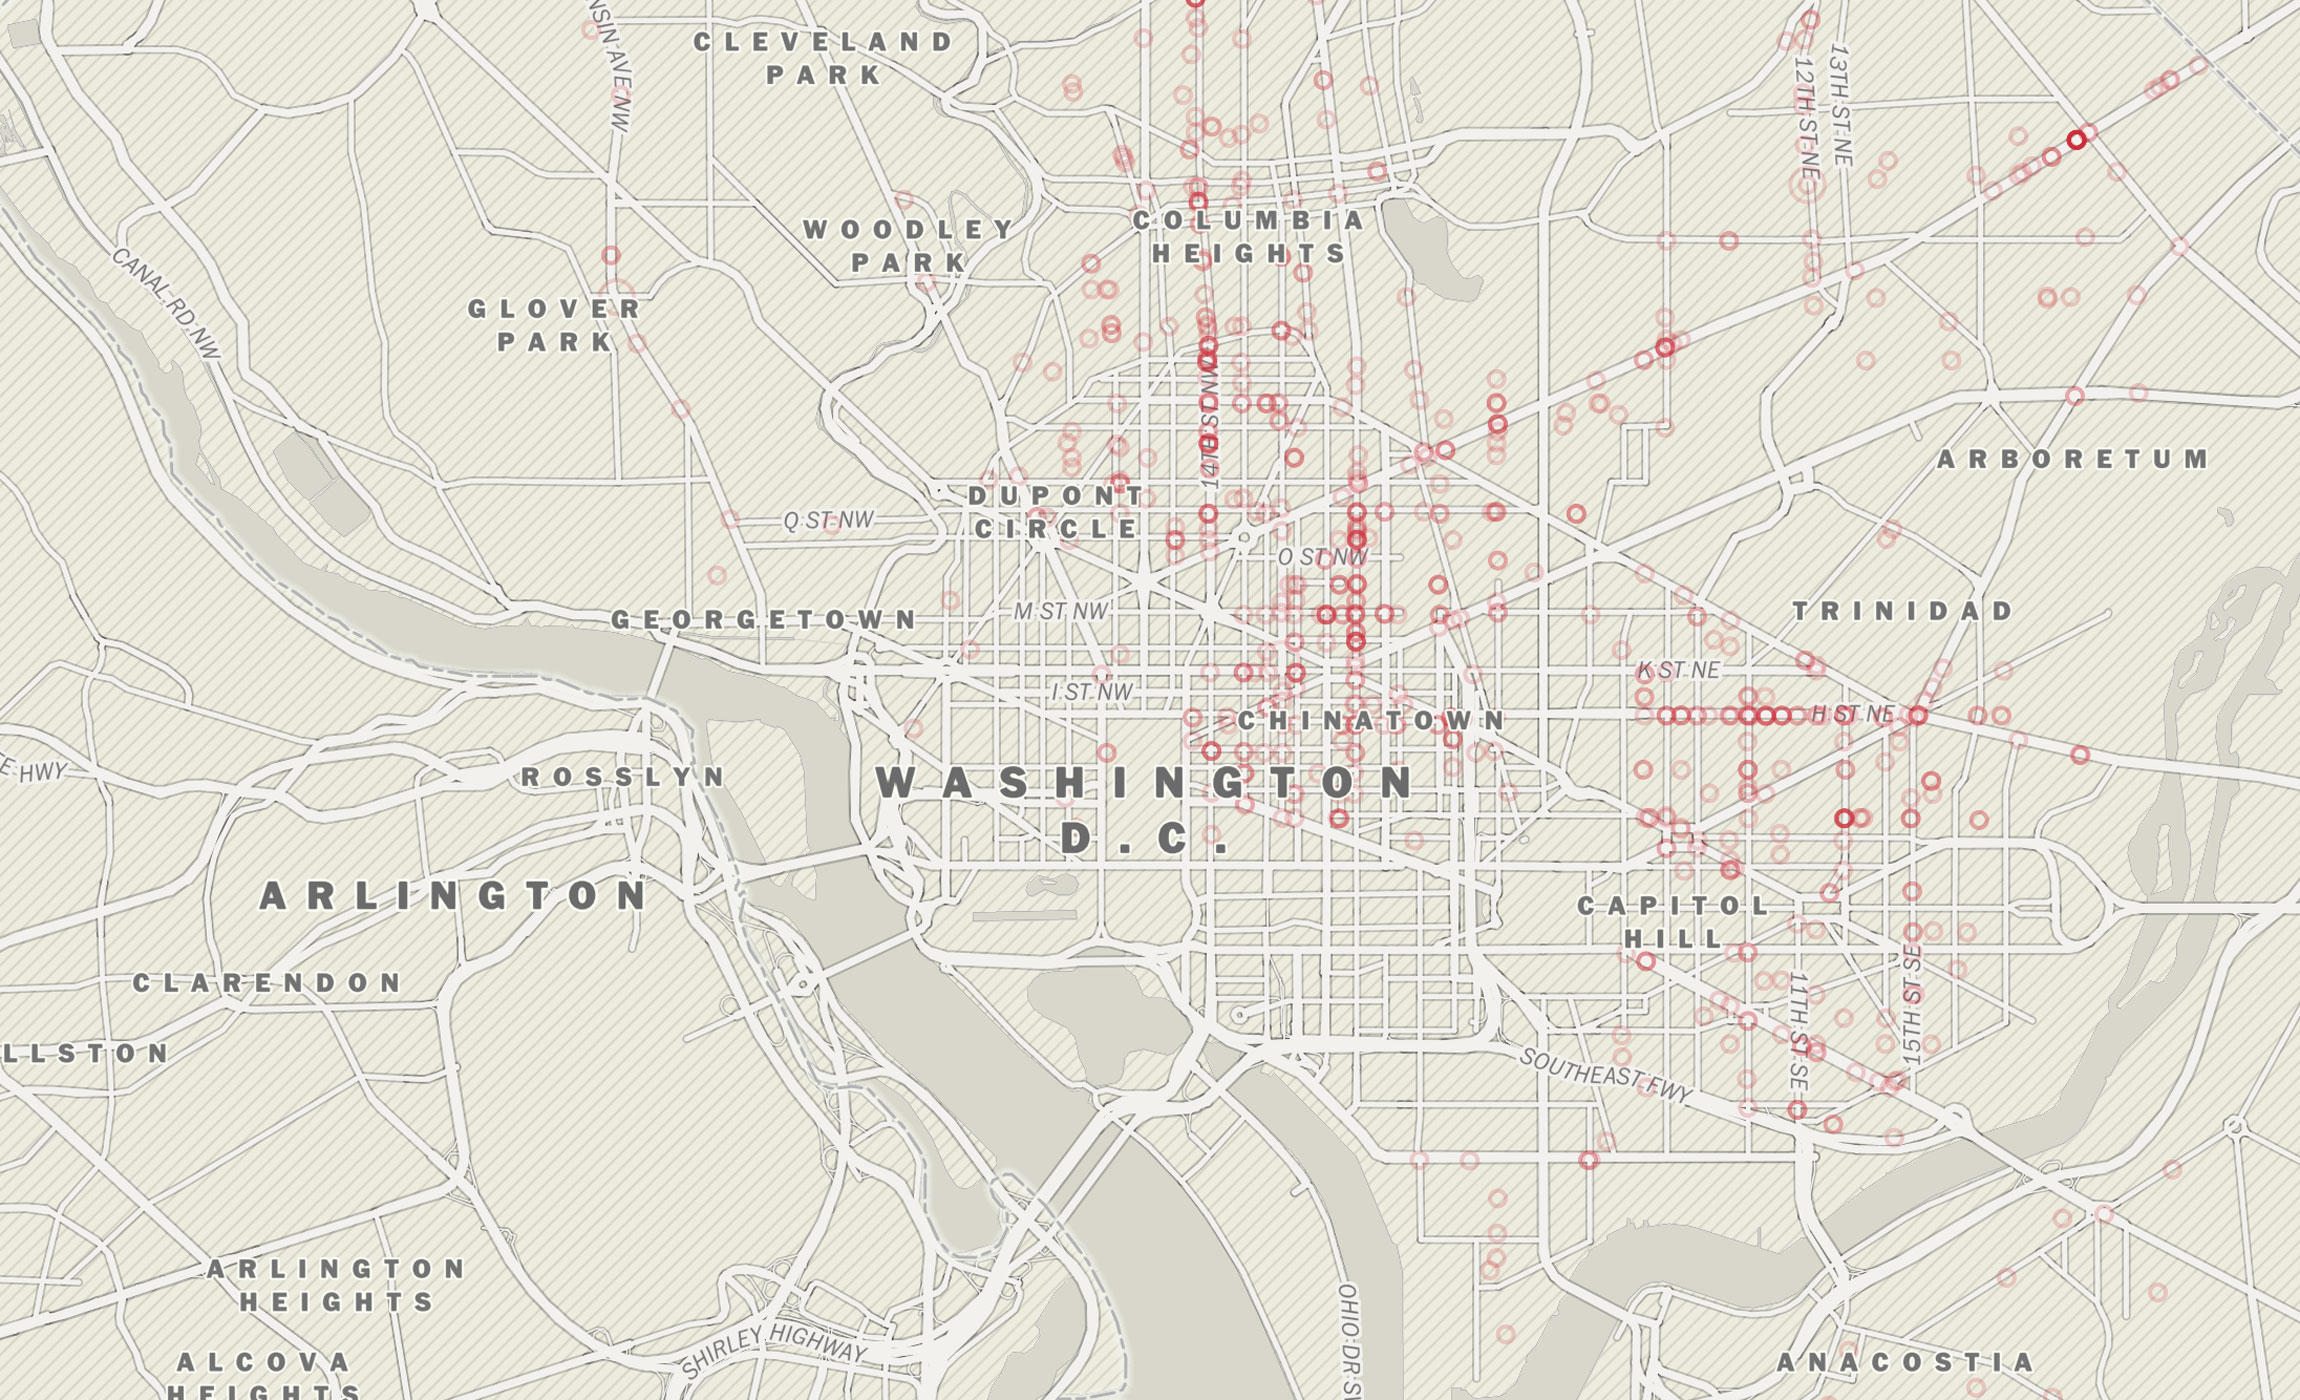
The four days in 1968 that reshaped D.C.
We built this around a list of more than 3,000 declassified Secret Service logs that detailed calls made during the riots. More than making a simple map, though, we wanted to bring the reader back to 1968. I helped research archival city planning documents and damage assessments, as well as developed the interactive maps and scrolling interface used in the story. You can read more about how we built this story at Open News's Source.